Step Procedure
IDE debugger view
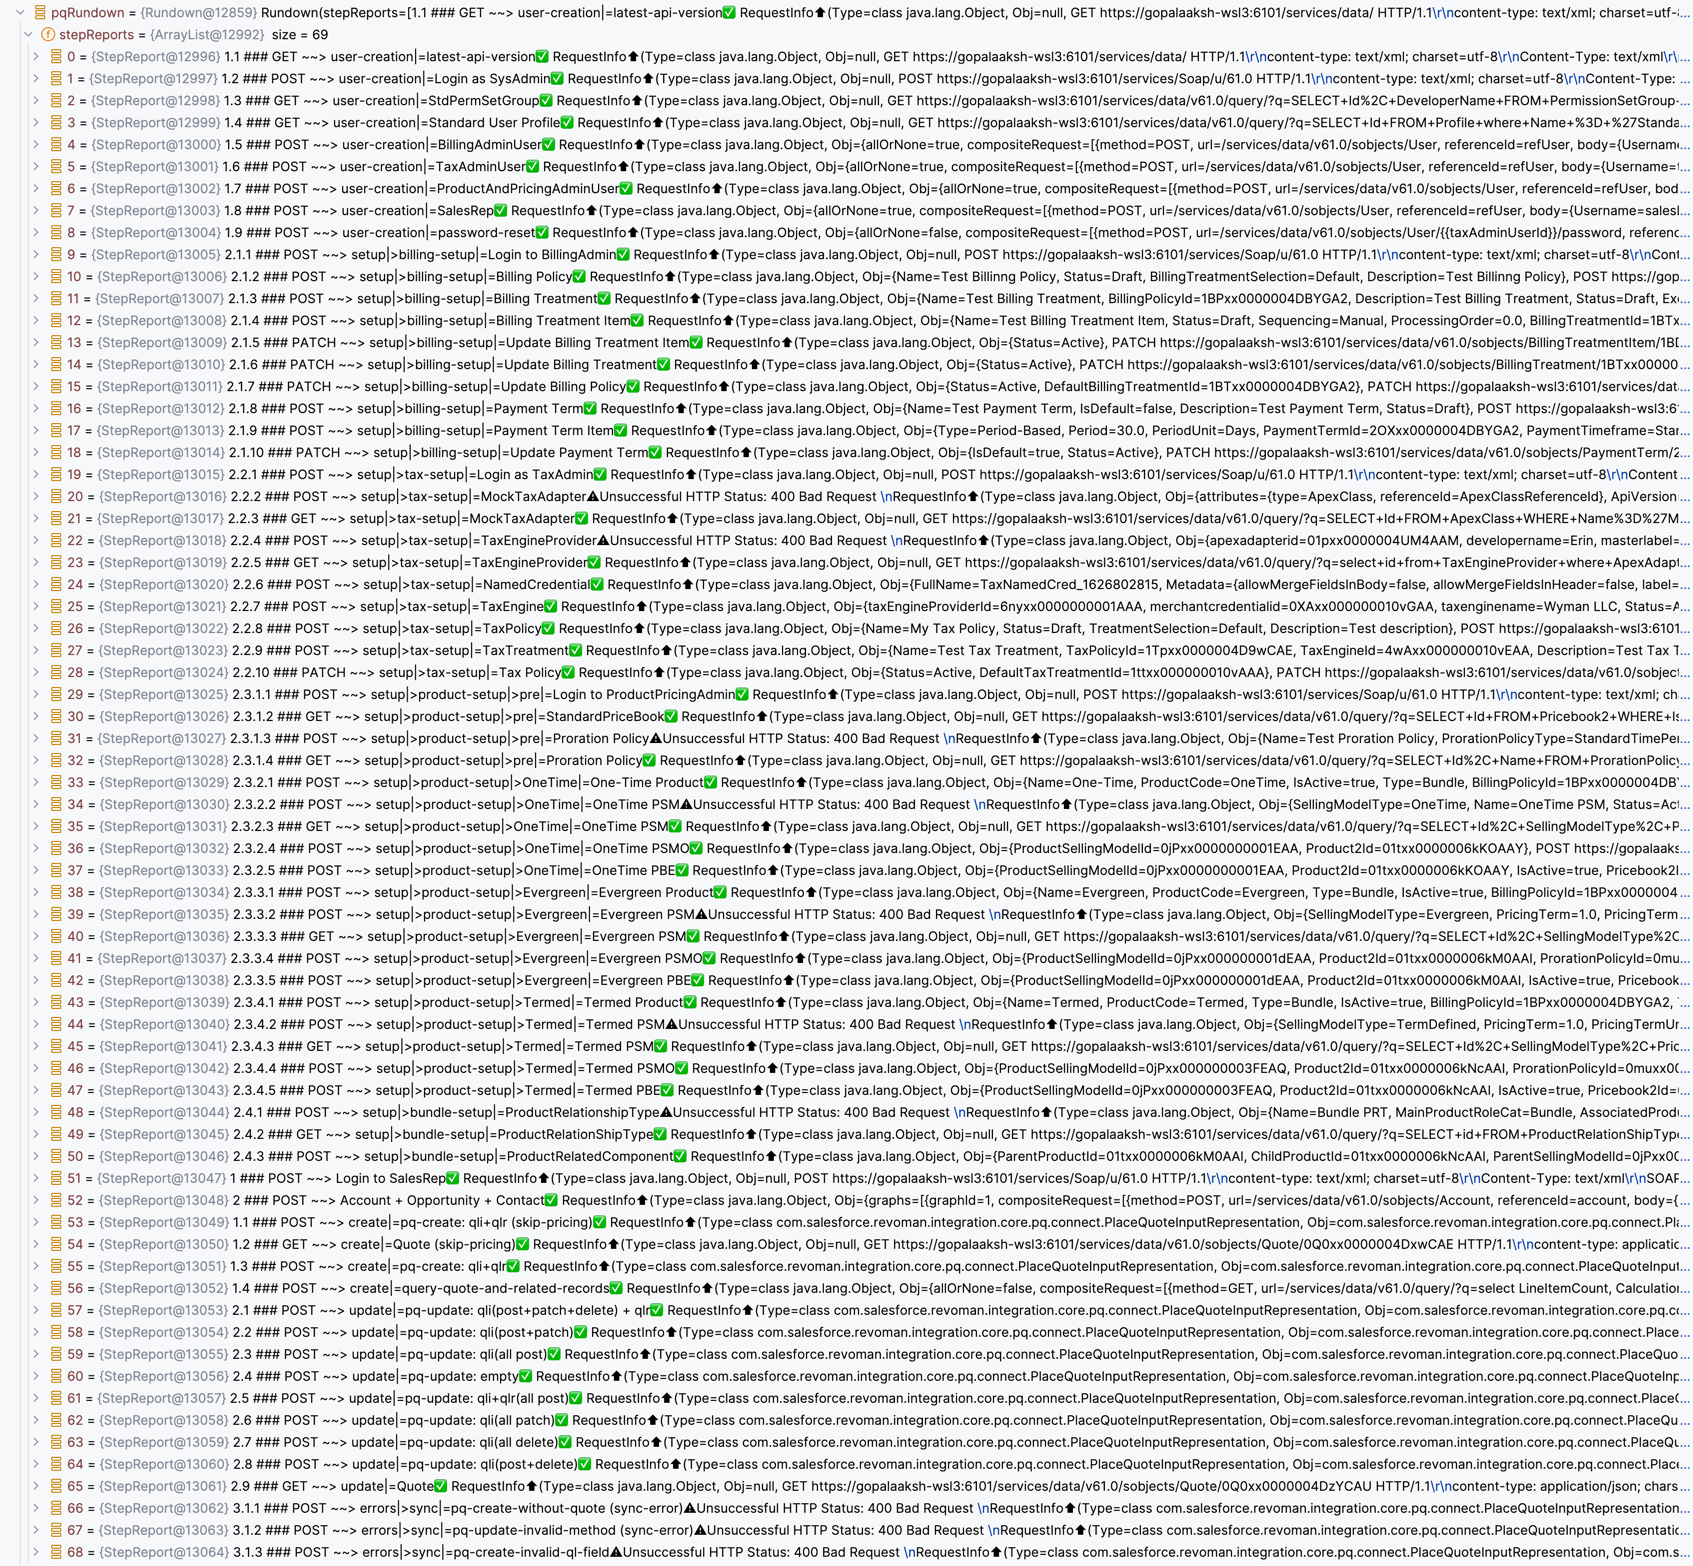
This tool has a particular emphasis on the Debugging experience. Here is what a debugger view of a Rundown looks like:
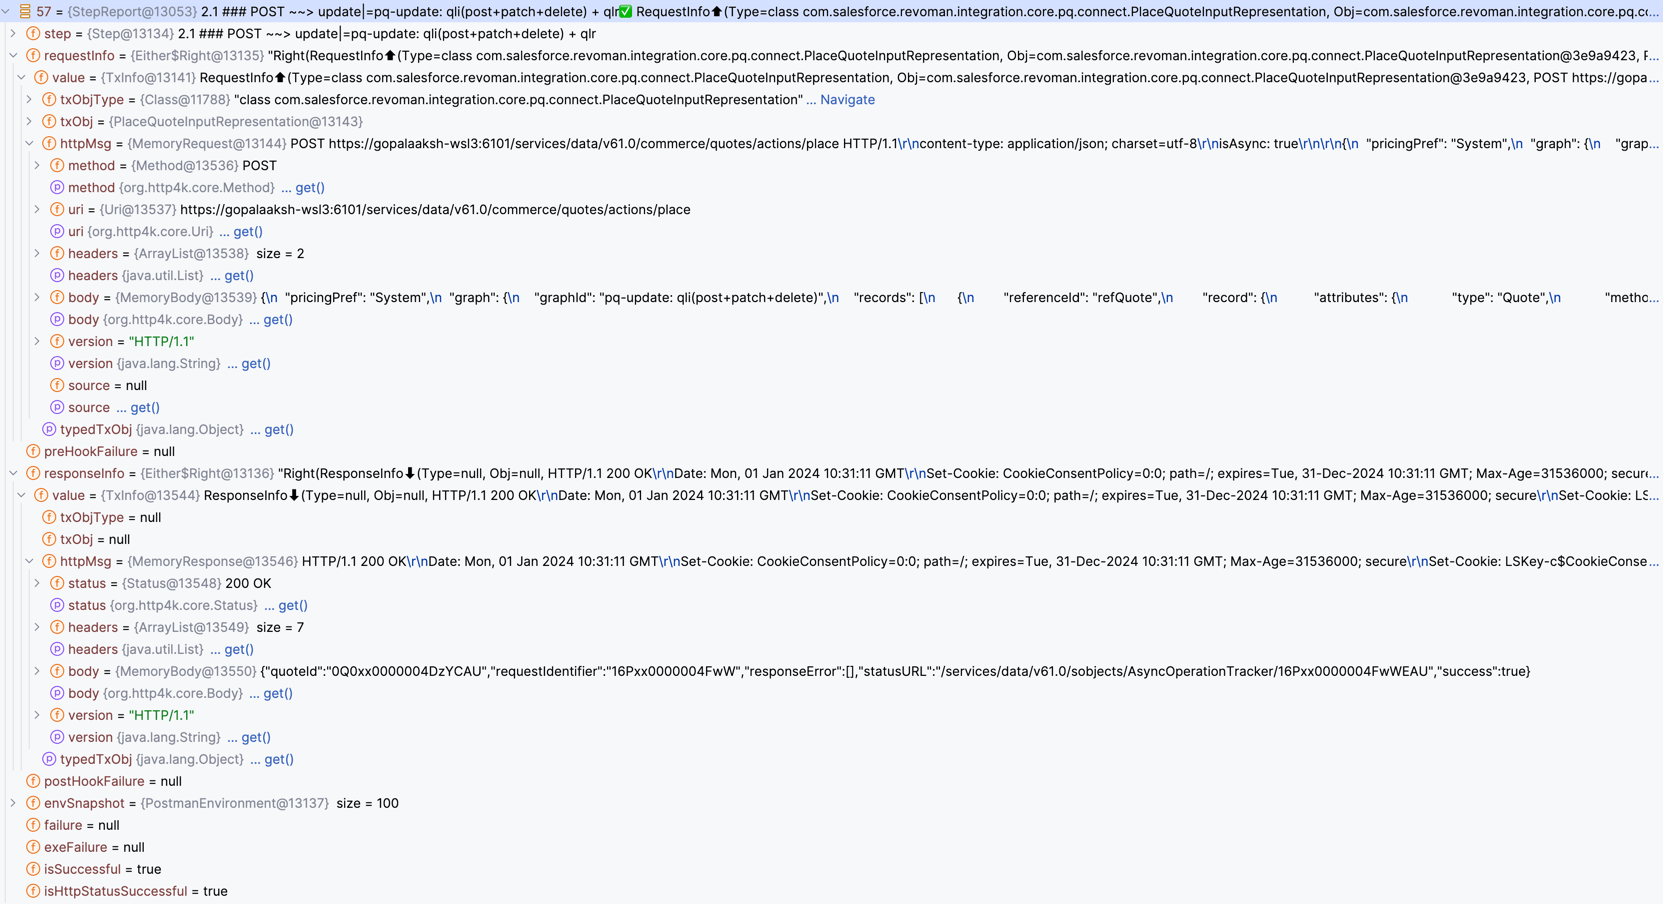
🔍 Let’s zoom into a detailed view of one of these Step reports, which contains complete Request and Response info along with failure information if any:
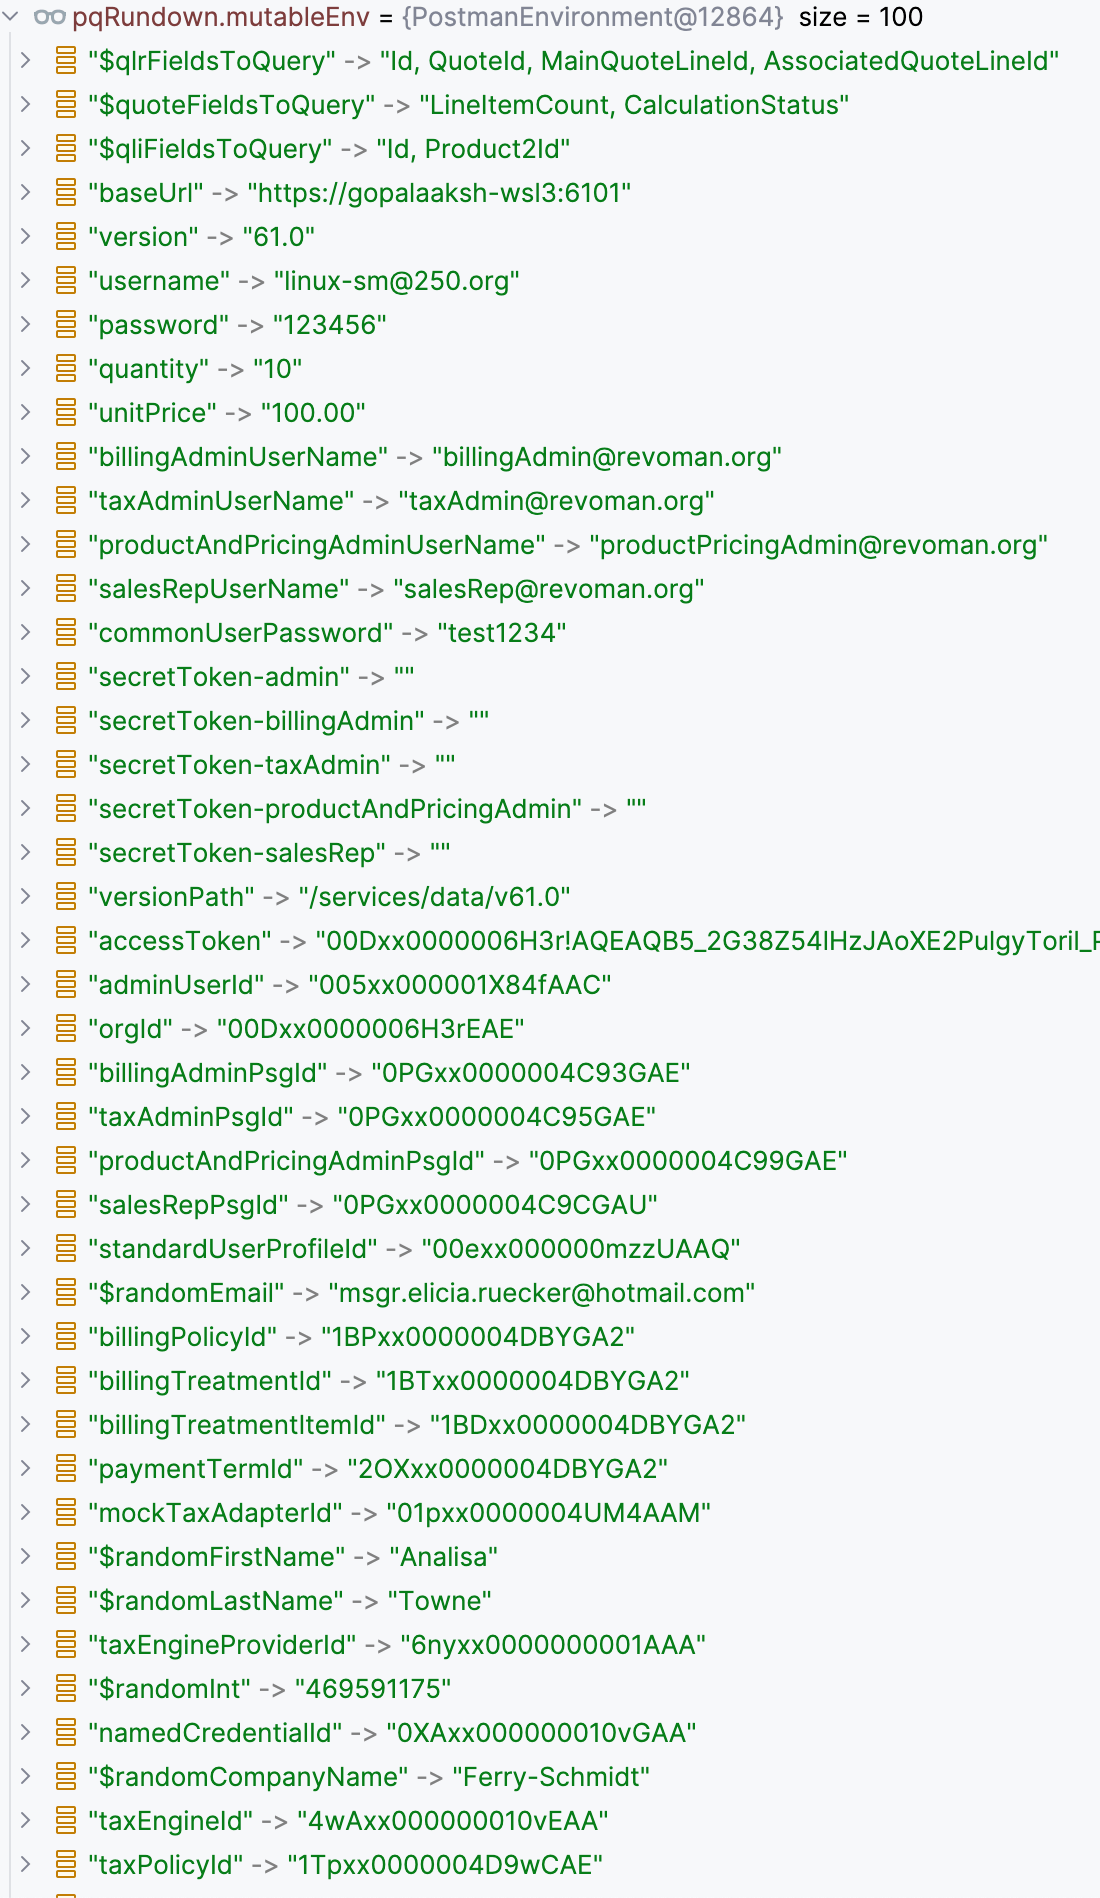
Here are the environment key-value pairs accumulated along the entire execution and appended to the environment from the file and dynamicEnvironment supplied:
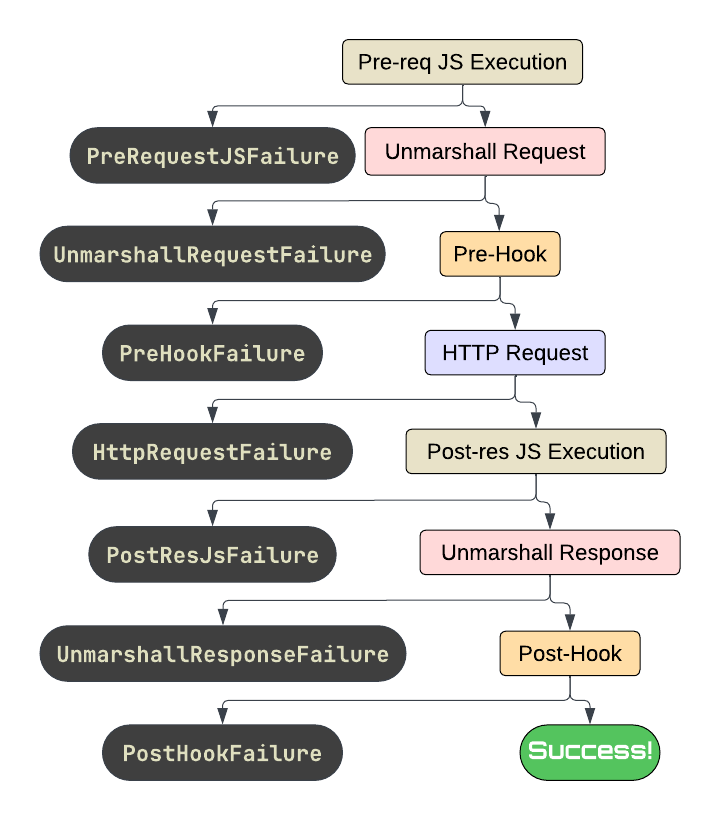
The Step Lifecycle
A Step waterfalls through all these stages and if there is any exception at any stage, the step procedure fails-fast, and ReṼoman captures the Failure in the respective StepReport:
|
Failure Hierarchy
Here is the failure hierarchy of what can go wrong in this process
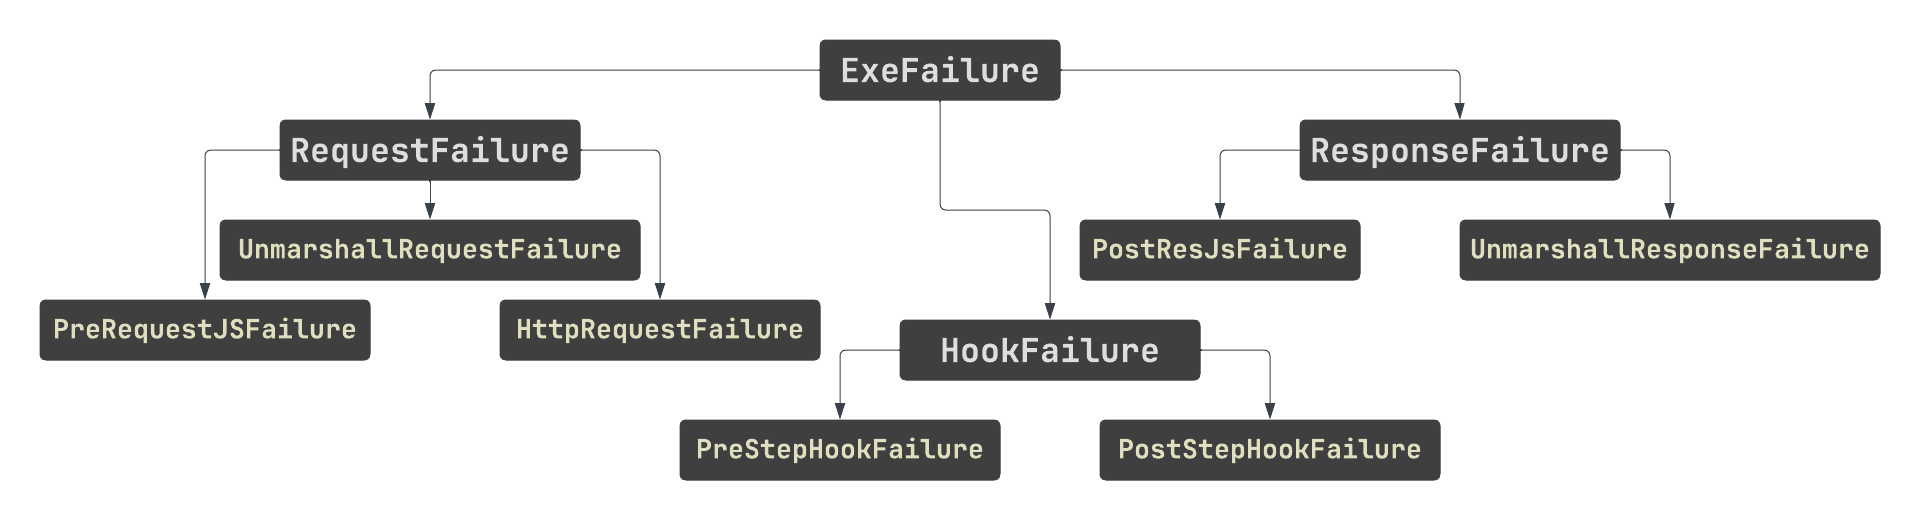
These failures are assertion friendly and provide clear messages with necessary stacktraces to help you troubleshoot.
| Each sub-step of the step procedure is timed; see Execution Timing Metrics. |